Cycle statistics
Cycle length and period length: how to read simple period statistics
Cycle statistics are useful when they stay humble. MiniCycle shows a few practical numbers so you can understand your recent pattern without treating every variation as a problem.
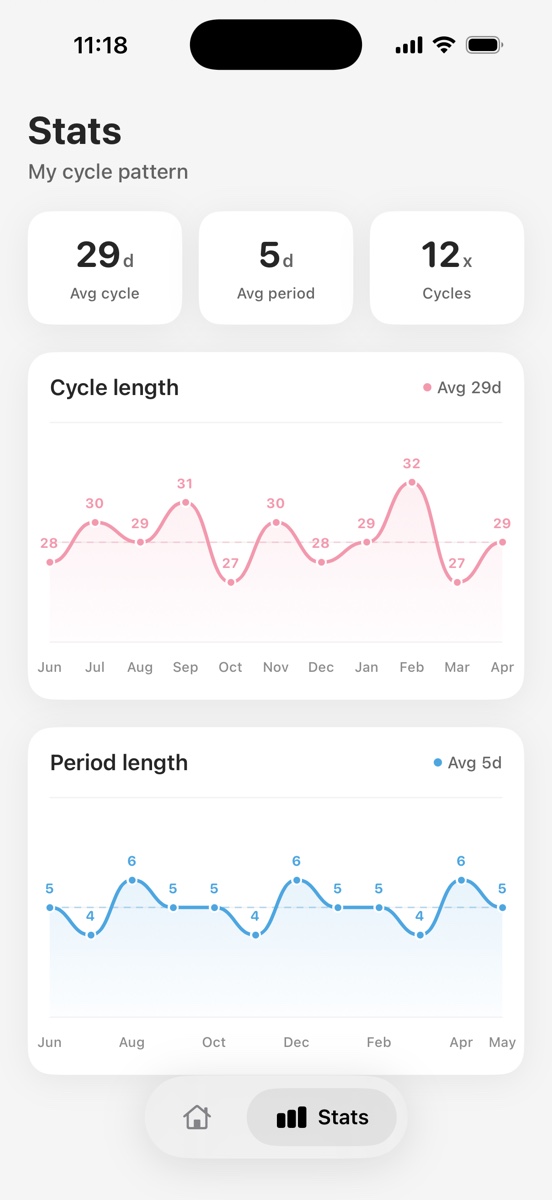
Cycle length
Cycle length means the number of days from the first day of one period to the first day of the next. ACOG patient guidance describes common cycle ranges, but individual patterns vary. MiniCycle uses your saved start dates to estimate your own recent rhythm.
Period length
Period length means how many days bleeding is recorded for a period. MiniCycle estimates this from closed period ranges and lets a manual setting take priority when you already know your typical length.
Why a median can be useful
A plain average can move too much when one record is unusual. A median-style value is less sensitive to one very short or very long cycle. That is why MiniCycle trims outliers when enough records exist.
What statistics should not imply
A number on a chart is not a diagnosis. A cycle can change for many reasons, and apps cannot know the medical context behind the change. Statistics are best used as a prompt to notice patterns, not as a substitute for clinical judgment.
How to make the numbers better
The most useful input is consistent period start logging. You do not need to record every possible health detail. For MiniCycle, accurate start and end dates are enough to make the calendar and statistics more useful over time.
How to read the trend without overreading it
A stable line can be reassuring, but a small change is not automatically a problem. Cycle length and period length are signals to observe over time. MiniCycle keeps the charts simple because the goal is to notice patterns, not to turn each month into a performance score.
When a value looks different, the next question is context. Was the period logged late? Was the end date adjusted? Were there travel, sleep, stress, medication, or health changes? A chart can help you ask better questions, but it cannot answer all of them.
Why recent data is more useful than lifetime data
A lifetime average can hide the pattern that matters now. MiniCycle focuses on recent records because people often want to understand the current rhythm of their body, not a number diluted by very old cycles. This is also why the app keeps the statistics compact rather than building a large analytics dashboard.
Recent data is still only as good as the records behind it. If a start date was missed or an end date was never closed, the statistic can shift. The app is designed so the best improvement is simple: record start and end dates consistently.
What to bring to a healthcare visit
If you decide to discuss your cycle with a clinician, dates are often more useful than vague memory. A simple list of period starts, period lengths, and notable changes can support that conversation. MiniCycle's statistics are meant to make that review easier, not to replace the medical conversation itself.
Examples of useful questions
Instead of asking whether one cycle was good or bad, ask whether the recent pattern is changing. Did several cycles become shorter? Did period length stay stable while cycle length changed? Did a single unusual month return to the prior pattern afterward? These questions are better suited to a simple chart than a single score.
MiniCycle's statistics view is built around that kind of review. The cards summarize recent averages, while the line charts show whether the saved records are mostly stable or starting to drift. The app does not try to explain why the pattern changed, because that explanation depends on context outside the calendar.
How many data points to show
More data is not always clearer on a small phone screen. Showing too many points can make labels overlap and reduce the chart to decoration. MiniCycle caps the visible statistics so the current pattern remains readable, while still using the saved records behind the scenes for calendar estimates where appropriate.
MiniCycle is built for a clean iPhone period calendar, local records, simple statistics, and a home screen widget.
View on the App Store