Cycle statistics
What the MiniCycle statistics tab shows about your cycles
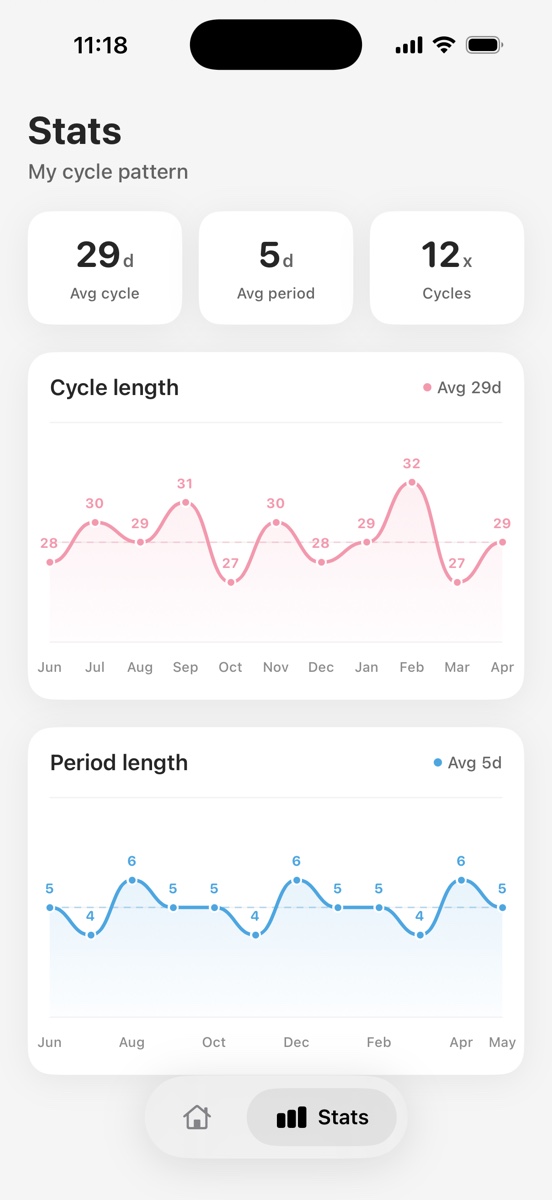
Open the statistics tab in MiniCycle and you get two plain numbers: your recent cycle length and your recent period length. No score, no grade, no streak. The tab reads from the period dates you have already logged and works out a couple of summaries you can glance at. It is worth knowing how each number is built, where the figures come from, and one design choice that surprises people: the tab only looks at your recent cycles, not your whole history.
Where the tab is, and what it shows
The statistics tab sits next to the home calendar; you switch to it from the tab bar or by swiping across. What it shows is deliberately short. Two summaries lead: a recent cycle length, measured from one period start to the next, and a recent period length, the number of days a period runs. Both are drawn from the start and end dates you have logged, and both are computed on your device.
There is no separate data to download and nothing uploaded to make the tab work. If you have logged only a couple of periods, the numbers are thin, and the tab reflects that. The more consistent your start dates, the more the summaries settle into something that actually looks like you.
How MiniCycle works out your cycle length
Cycle length is the gap from one period start to the next. To estimate a typical value, MiniCycle uses up to your latest 12 period records and leans on a median rather than a mean. Once there are at least 10 measured intervals, it first drops the single shortest and the single longest, then takes the median of what is left. With little history to go on, it falls back to a 29-day default.
The median is doing real work here. A plain average can lurch when one cycle is unusual: a stressful month, an illness, a long stretch of travel. A median with the extremes trimmed barely moves for one odd cycle, so the number you see tracks your usual rhythm instead of your worst month. The 29-day fallback is not arbitrary either. In a study of 612,613 cycles published in npj Digital Medicine, the mean cycle length was 29.3 days, and only about 13% of cycles were exactly 28 days long. The textbook 28-day cycle is real, but it is one point in a wide range.
Where the period-length number comes from
Period length is how many days a single period lasts. If you have set a period length by hand, that manual value wins; the tab respects what you told it. Otherwise MiniCycle estimates it from your recent closed period ranges, the ones with both a start and an end logged. When there is nothing to estimate from, it uses a 5-day default.
This split is on purpose. Some people know their period runs four days and would rather set it once; others prefer to let the app read it off the dates. Either way, an accurate end date makes the estimate better, since a period left open or ended on the wrong day skews the length.
Why it only shows your recent cycles
Here is the part that catches people out. The tab caps the data it displays at 24 points. It is tempting to assume more history is always better, that an average across every period you have ever logged would be the truest number. It usually is not.
Your cycle is not fixed for life. The same large dataset found that cycle length tends to drift down with age, and Mayo Clinic notes that cycles often shorten and grow more regular over the years. A figure built from your last couple of years says more about you now than one diluted by cycles from a phone you no longer own. The cap also keeps the chart readable instead of a cramped wall of bars. One detail worth separating: the display caps at 24 recent points, while the typical cycle-length estimate draws on up to your latest 12 records. They are different windows, on purpose, one for what you see and one for what gets summarized.
What the numbers can't tell you
A summary on a tab is not a diagnosis. A cycle can shift for many ordinary reasons, and the app cannot know the context behind a change. The statistics are reference information drawn from your own dates, useful for noticing a pattern, not for judging your health.
For the medical thresholds, the better source is a clinician. Mayo Clinic suggests talking to a provider if your periods come less than 21 or more than 35 days apart, stop for more than 90 days when you are not pregnant, last longer than seven days, turn heavier than usual, or start arriving irregularly after having been regular. A number on the tab might prompt that conversation; it does not replace it.
Getting numbers that mean something
The single most useful habit is logging your period start each time, on the day it starts. That one date feeds the cycle-length estimate, the predictions, and the tab. Adding accurate end dates sharpens the period-length figure on top of that.
You do not need to record every symptom for the statistics to work; consistent start and end dates are enough. If you want to watch your own rhythm settle over a few months, the statistics tab in MiniCycle is where it shows up, kept on your device and nowhere else.
Reading your own statistics tab
Say you have logged six periods over the past half year. The tab shows a recent cycle length of, for example, 30 days and a period length of 5 days. Those are summaries of what you entered, not predictions of the future; the calendar handles the forward estimate. If your last two cycles ran 27 and 33 days, a median-style summary lands somewhere sensible in the middle rather than chasing either one.
Now say one of those cycles was 45 days because you were ill and skipped logging for a while. With enough records, that outlier is exactly the kind of value the estimate trims before taking the median, so a single rough month does not redefine your normal. If you have only two or three periods logged, though, there is not enough to trim, and the numbers will swing more until more dates accumulate.
Frequently asked questions
How many cycles does the statistics tab use? The tab displays up to 24 recent data points, and the typical cycle-length estimate draws on up to your latest 12 period records. Older entries beyond that are not erased; they are just not part of the current summary.
Why is my cycle length not 28 days? Because 28 is an average, not a rule. A study of more than 600,000 cycles put the mean at 29.3 days, with only about 13% landing exactly on 28. Your own recent number is more useful than the textbook one.
Does the tab show an average or a median? For cycle length it leans on a median and trims the shortest and longest values once there are enough records, which keeps one unusual cycle from skewing the result.
Why does the number change when I log a new period? Each new start date updates the recent window the estimate works from, so the summary shifts to reflect your latest cycles. That is the tab doing its job.
Is my statistics data sent anywhere? Your period records stay on your device. The tab reads from them locally, with no account and no MiniCycle server holding your history.
The one-line version
The MiniCycle statistics tab summarizes two things from your saved dates: a recent cycle length and a recent period length. Cycle length leans on a median of up to your latest 12 period records (dropping one shortest and one longest once there are at least 10 intervals, defaulting to 29 days with little history); period length uses your manual setting if you set one, otherwise an estimate from recent closed ranges, defaulting to 5 days. The tab displays up to 24 recent data points.
The cap on recent data is deliberate: cycle length drifts over the years, so a recent window reflects you now better than an all-time average, and a median keeps one unusual cycle from skewing the number. The summaries are reference information from your own dates, computed on your device, not a diagnosis. See a clinician if periods come less than 21 or more than 35 days apart, stop for more than 90 days without pregnancy, or turn irregular after being regular.
MiniCycle is built for a clean iPhone period calendar, local records, simple statistics, and a home screen widget.
View on the App Store